 eAtlas Data Catalogue
Bio-physical predictors of coastal land use change between 1999 and 2009 in the Great Barrier Reef coastal zone (NERP TE 9.4, JCU)
This dataset consist of inputs and intermediate results from the coastal scenario modelling. It is an analysis of the bio-physical factors that best explain the changes in QLUMP land use change between 1999 and 2009 along the Queensland coastal region for the classifications used in the future coastal modelling.
Methods:
The input layers (variables etc) were produced using a range of sources as shown in Table 1. Source datasets were edited to produce raster dataset at 50m resolution and reclassified to suit the needs for the analysis.
The analysis was made using the IDRISI Land Use Change Modeler using multi-layer perceptron neural network with explanatory power of bio-physical variables. In this process a range of bio-physical layers such as slope, rainfall, distance to roads etc (see full list in Table 1) are used as potential explanatory variables for the changes in the land use. The neutral network is trained on a subset of the data then tested against the remaining data, thereby giving an estimate of the accuracy of the prediction. This analysis produces suitability maps for each of the transitions between different land use classifications, along with a ranking of the important bio-physical factors for explaining the changes.
The 1999 - 2009 Land use change was analysed with of which 4 were found to be the strongest predictors of the change for various transitions between one land use and another. This dataset includes the rasters of the 4 best predictors along with a sample of the highest accuracy transition probability maps.
Format:
Table 1 (Table 1 NERP 9_4 e-atlas dataset)
This table contains the list of names, short descriptions, data source and data manipulation for the input rasters for the land use change model
All GIS files are in GDA 94 Albers Australia coordinate system.
1999.tif
This layer shows a rasterised form of the QLUMP land use (clipped to the GBR coastal zone as defined in 9.4) for 1999 used for analysis of bio-physical predictors of land use change. The original QLUMP data was re-classified into 18 classes then rasterised at 50m resolution. This raster was then resampled to a 500m resolution.
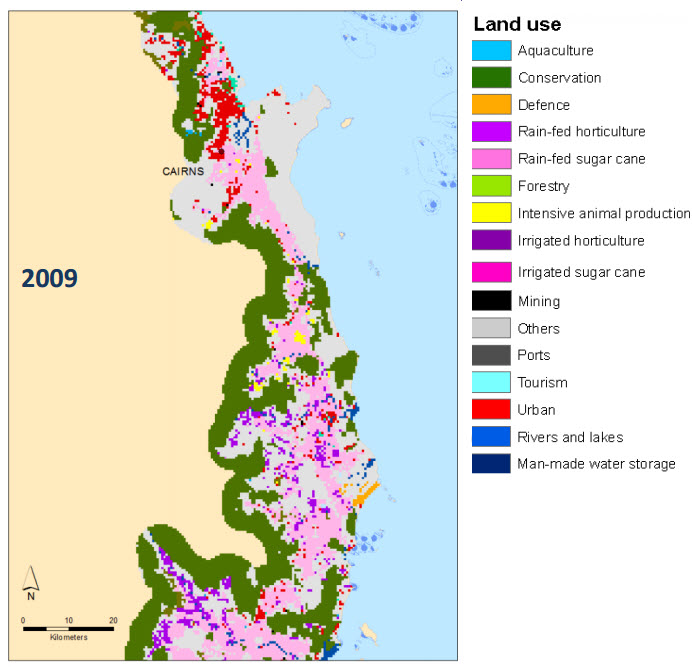
2009.tif
This layer shows a rasterised form of the QLUMP land use (clipped to the GBR coastal zone as defined in 9.4) for 2009 used for analysis of bio-physical predictors of land use change. The original QLUMP data was re-classified into 18 classes (with addition of tourism land use) then rasterised at 50m resolution. This raster was then resampled to a 500m resolution.
Rainfall.rst
This layer shows the average annual rainfall (in mm) sourced from the Average Yearly Rainfall Isohyets Queensland dataset (clipped to the GBR coastal zone as defined in 9.4) used for analysis of bio-physical predictors of land use change. The data was re-classified and resampled at 50m resolution.
Slope.rst
This layer shows the slope (in degrees) value at 50m pixel resolution (clipped to the GBR coastal zone as defined in 9.4) used for analysis of bio-physical predictors of land use change. The slope was derived from the Australian Digital Elevation Model in ArcGIS (using the Slope tool of the 3D analyst Tools) at a 200m resolution. The data was resampled at 50m resolution.
SeaDist.rst
This layer shows the distance (in m) to the nearest coastline (including estuaries) at 50m pixel resolution used for analysis of bio-physical predictors of land use change. It was created by applying an Euclidean distance function (in ArcGIS in the Spatial Analyst toolbox) to the “Mainland coastline” feature in the GBR features dataset available from GBRMPA.
UrbanDist.rst
This layer shows the distance (in m) to the nearest pixel of urban land use at 50m pixel resolution used for analysis of bio-physical predictors of land use change. It was created by applying an Euclidean distance function (in ArcGIS in the Spatial Analyst toolbox) to the QLUMP 2009 dataset on the selected urban polygons.
Transition_potential_Other_to_DryHorticulture.rst
This layer shows the probability for each pixel (50m resolution) of the coastal to transition from the land use class Other to Rain-fed Horticulture. Areas originally of a different land use class are given no values. This was produced by analysing the patterns of land use change between 1999 and 2009 in IRDISI as part of the Land Use Change Modeler where the main bio-physical variables affecting the pattern of change were identified. See details in the model results file. A high accuracy rate of 92% was calculated during testing.
Land Change Modeler MLP Model Results_Rain-fed_horticulture.docx
This shows the results of the analysis of change from land use Others to rain-fed horticulture between 1999 and 2009 using four variables: Distance to existing horticulture, Rainfall, Soil type and Slope.
Transition_potential_Other_to_Drysugar.rst
This layer shows the probability for each pixel (50m resolution) of the coastal to transition from the land use class Other to Rain-fed Sugar cane. Areas originally of a different land use class are given no values. This was produced by analysing the patterns of land use change between 1999 and 2009 in IRDISI as part of the Land Use Change Modeler where the main bio-physical variables affecting the pattern of change were identified. See details in the model results file. A high accuracy rate of 84% was calculated during testing.
Land Change Modeler MLP Model Results_Rain-fed_sugar.docx
This shows the results of the analysis of change from land use Others to rain-fed sugar between 1999 and 2009 using three variables: Rainfall, Soil type and Slope.
Transition_potential_Other_to_Forestry.rst
This layer shows the probability for each pixel (50m resolution) of the coastal to transition from the land use class Other to Forestry. Areas originally of a different land use class are given no values. This was produced by analysing the patterns of land use change between 1999 and 2009 in IRDISI as part of the Land Use Change Modeler where the main bio-physical variables affecting the pattern of change were identified. See details in the model results file. A good accuracy rate of 73% was calculated during testing.
Land Change Modeler MLP Model Results_Forestry.docx
This shows the results of the analysis of change from land use Others to Forestry between 1999 and 2009 using three variables: Rainfall, Soil type and Proximity to existing forestry.
Transition_potential_Other_to_Urban.rst
This layer shows the probability for each pixel (50m resolution) of the coastal to transition from the land use class Other to Urban. Areas originally of a different land use class are given no values. This was produced by analysing the patterns of land use change between 1999 and 2009 in IRDISI as part of the Land Use Change Modeler where the main bio-physical variables affecting the pattern of change were identified. See details in the model results file. A good accuracy rate of 75% was calculated during testing.
Land Change Modeler MLP Model Results_Urban.docx
This shows the results of the analysis of change from land use Others to Urban between 1999 and 2009 using two variables: Slope and Proximity to existing urban areas.
Simple
Identification info
- Date (Publication)
- 2015-01-19
- Cited responsible party
-
Role Organisation Name Telephone Delivery point City Administrative area Postal code Country Electronic mail address Principal investigator ARC Centre of Excellence for Coral Reef Studies Augé, Amélie amelie.auge@jcu.edu.au Collaborator ARC Centre of Excellence for Coral Reef Studies Pressey, Bob
- Point of contact
-
Role Organisation Name Telephone Delivery point City Administrative area Postal code Country Electronic mail address Point of contact ARC Centre of Excellence for Coral Reef Studies Augé, Amélie amelie.auge@jcu.edu.au
- Spatial representation type
- Grid
- Topic category
-
- Planning cadastre
Extent
Extent
- Description
- GBR Coastal Zone

Temporal extent
- Time position
- 1999-01-01T00:00:00
- Time position
- 2009-12-31T00:00:00
- Keywords (Theme)
-
- marine
Resource constraints
- Linkage
-
http://i.creativecommons.org/l/by/3.0/au/88x31.png
License Graphic
- Title
- Creative Commons Attribution 3.0 Australia License
- Cited responsible party
-
Role Organisation Name Telephone Delivery point City Administrative area Postal code Country Electronic mail address
- Website
-
http://creativecommons.org/licenses/by/3.0/au/
License Text
Associated resource
- Association Type
- Dependency
- Initiative Type
- Project
- Title
- NERP TE Project 9.4 - Conservation planning for a changing coastal zone, 2011-2014 (JCU)
Identifier
- Language
- English
- Character encoding
- UTF8
Distribution Information
Metadata constraints
- Linkage
-
http://i.creativecommons.org/l/by/3.0/au/88x31.png
License Graphic
- Title
- Creative Commons Attribution 3.0 Australia License
- Cited responsible party
-
Role Organisation Name Telephone Delivery point City Administrative area Postal code Country Electronic mail address
- Website
-
http://creativecommons.org/licenses/by/3.0/au/
License Text
Metadata
- Metadata identifier
- urn:uuid/1d0c4d84-ba83-4a8e-be6f-b792cc552a5b
- Language
- English
- Character encoding
- UTF8
- Contact
-
Role Organisation Name Telephone Delivery point City Administrative area Postal code Country Electronic mail address Point of contact Australian Institute of Marine Science (AIMS) eAtlas Data Manager Voice Facsimile PRIVATE MAIL BAG 3, TOWNSVILLE MAIL CENTRE Townsville Queensland 4810 Australia e-atlas@aims.gov.au
- Parent metadata
Type of resource
- Resource scope
- Dataset
- Metadata linkage
-
https://eatlas.org.au/data/uuid/1d0c4d84-ba83-4a8e-be6f-b792cc552a5b
Point of truth URL of this metadata record
- Date info (Creation)
- 2015-07-01T20:47:23
- Date info (Revision)
- 2023-09-18T07:37:23
Metadata standard
- Title
- ISO 19115-3:2018