 eAtlas Data Catalogue
Connectivity of North East Australia Seascapes – Data and Maps (NESP TWQ 3.3.3, AIMS and JCU)
This dataset shows the results of mapping the connectivity of key values (natural heritage, indigenous heritage, social and historic and economic) of the Great Barrier Reef with its neighbouring regions (Torres Strait, Coral Sea and Great Sandy Strait). The purpose of this mapping process was to identify values that need joint management across multiple regions.
It contains a spreadsheet containing the connection information obtained from expert elicitation, all maps derived from this information and all GIS files needed to recreate these maps.
This dataset contains the connection strength for 59 attributes of the values between 7 regions (GBR Far Northern, GBR Cairns-Cooktown, GBR Whitsunday-Townsville, GBR Mackay-Capricorn, Torres Strait, Coral Sea and Great Sandy Strait) based on expert opinion. Each connection is assessed based on its strength, mechanism and confidence. Where a connection was known to not exist between two regions then this was also explicitly recorded.
A video tutorial on this dataset and its maps is available from https://vimeo.com/335053846.
Methods:
The information for the connectivity maps was gathered from experts (~30) during a 3-day workshop in August 2017. Experts were provided with a template containing a map of Queensland and the neighbouring seas, with an overlay of the regions of interest to assess the connectivity. These were Torres Strait, GBR:Far North Queensland, GBR:Cairns to Cooktown, GBC: Townsville to Whitsundays, GBR: Mackay to Capricorn Bunkers and Great Sandy Strait (which includes Hervey bay). A range of reference maps showing locations of the values were provided, where this information could be obtained.
As well as the map the template provided 7x7 table for filling in the connectivity strength and connection type between all combinations of these regions. The experts self-organised into groups to discuss and complete the template for each attribute to be mapped. Each expert was asked to estimate the strength of connection between each region as well as the connection mechanism and their confidence in the information.
Due to the limited workshop time the experts were asked to focus on initially recording the connections between the GBR and its neighbouring regions and not to worry about the internal connections in the GBR, or long-distance connections along the Queensland coast. In the second half of the workshop the experts were asked to review the maps created and expand on the connections to include those internal to the GBR.
After the workshop an initial set of maps were produced and reviewed by the project team and a range of issues were identified and resolved. Additional connectivity maps for some attributes were prepared after the workshop by the subject experts within the project team.
The data gathered from these templates was translated into a spreadsheet, then processing into the graphic maps using QGIS to present the connectivity information.
The following are the value attributes where their connectivity was mapped:
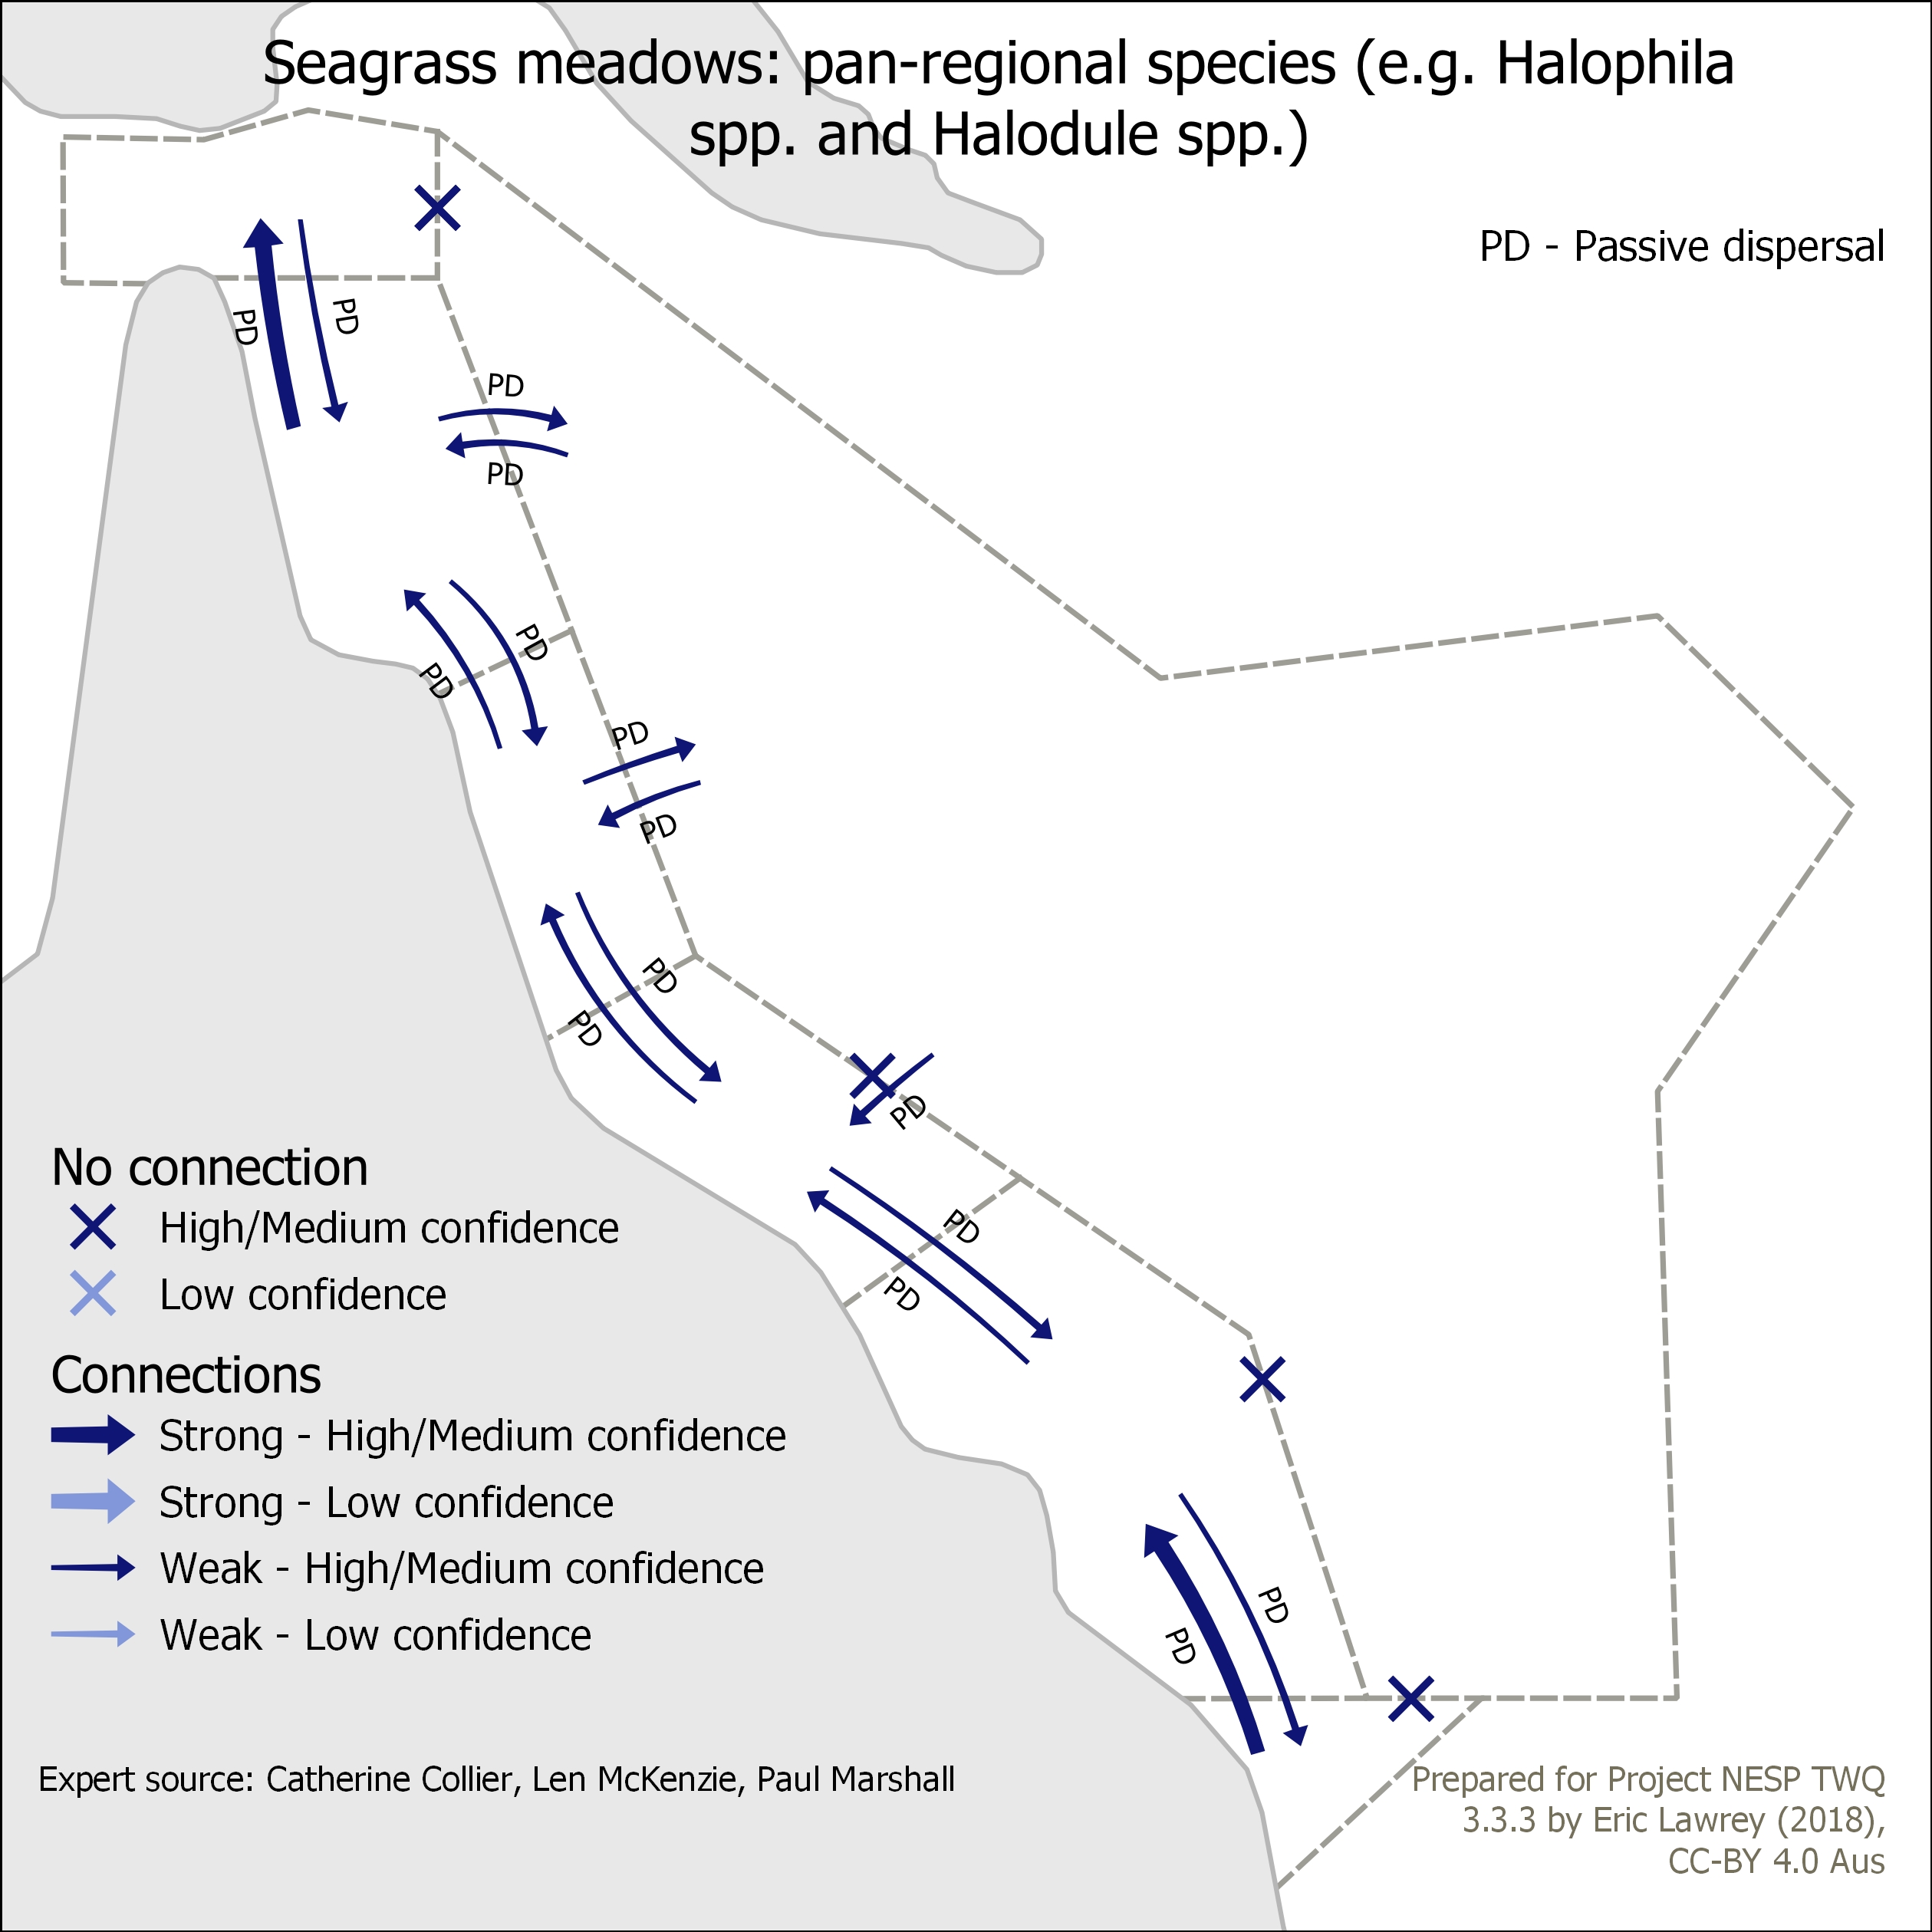
Seagrass meadows: pan-regional species (e.g. Halophila spp. and Halodule spp.)
Seagrass meadows: tropical/sub-tropical (Cymodocea serrulata, Syringodium isoetifolium)
Seagrass meadows: tropical (Thalassia, Cymodocea, Thalassodendron, Enhalus, Rotundata)
Seagrass meadows: Zostera muelleri
Mangroves & saltmarsh
Hard corals
Crustose coralline algae
Macroalgae
Crown of thorns starfish larval flow
Acropora larval flow
Casuarina equisetifolia & Pandanus tectorius
Argusia argentia
Pisonia grandis: cay vegetation
Inter-reef gardens (sponges + gorgonians) (Incomplete)
Halimeda
Upwellings
Pelagic foraging seabirds
Inshore and offshore foraging seabirds
Migratory shorebirds
Ornate rock lobster
Yellowfin tuna
Black marlin
Spanish mackerel
Tiger shark
Grey nurse shark
Humpback whales
Dugongs
Green turtles
Hawksbill turtles
Loggerhead turtles
Flatback turtles
Longfin & Shortfin Eels
Red-spot king prawn
Brown tiger prawn
Eastern king prawns
Great White Shark
Sandfish (H. scabra)
Black teatfish (H. whitmaei)
Location of sea country
Tangible cultural resources
Location of place attachment
Location of historic shipwrecks
Location of places of social significance
Location of commercial fishing activity
Location of recreational use
Location of tourism destinations
Australian blacktip shark (C. tilstoni)
Barramundi
Common black tip shark (C. limbatus)
Dogtooth tuna
Grey mackerel
Mud crab
Coral trout (Plectropomus laevis)
Coral trout (Plectropomus leopardus)
Red throat emperor
Reef manta
Saucer scallop (Ylistrum balloti)
Bull shark
Grey reef shark
Limitations of the data:
The connectivity information in this dataset is only rough in nature, capturing the interconnections between 7 regions.
The connectivity data is based on expert elicitation and so is limited by the knowledge of the experts that were available for the workshop. In most cases the experts had sufficient knowledge to create robust maps. There were however some cases where the knowledge of the participants was limited, or the available scientific knowledge on the topic was limited (particularly for the ‘inter-reefal gardens’ attribute) or the exact meaning of the value attribute was poorly understood or could not be agreed up on (particularly for the social and indigenous heritage maps). This information was noted with the maps.
These connectivity maps should be considered as an initial assessment of the connections between each of the regions and should not be used as authoritative maps without consulting with additional sources of information.
Each of the connectivity links between regions was recorded with a level of confidence, however these were self-reported, and each assessment was performed relatively quickly, with little time for reflection or review of all the available evidence. It is likely that in many cases the experts tended to have a bias to mark links with strong confidence. During subsequent revisions of some maps there were substantial corrections and adjustments even for connections with a strong confidence, indicating that there could be significant errors in the maps where the experts were not available for subsequent revisions.
Each of the maps were reviewed by several project team members with broad general knowledge.
Not all connection combinations were captured in this process due to the limited expert time available. A focus was made on capturing the connections between the GBR and its neighbouring regions. Where additional time was available the connections within 4 regions in the GBR was also captured.
The connectivity maps only show connections between immediately neighbouring regions, not far connections such as between Torres Strait and Great Sandy Strait. In some cases the connection information for longer distances was recorded from the experts but not used in the mapping process.
The coastline polygon and the region boundaries in the maps are not spatially accurate. They were simplified to make the maps more diagrammatic. This was done to reduce the chance of misinterpreting the connection arrows on the map as being spatially explicit.
Format:
This dataset is made up of a spreadsheet that contains all the connectivity information recorded from the expert elicitation and all the GIS files needed to recreate the generated maps.
original/GBR_NESP-TWQ-3-3-3_Seascape-connectivity_Master_v2018-09-05.xlsx:
‘Values connectivity’: This sheet contains the raw connectivity codes transcribed from the templates produced prepared by the subject experts. This is the master copy of the connection information. Subsequent sheets in the spreadsheet are derived using formulas from this table.
1-Vertical-data: This is a transformation of the ‘Values connectivity’ sheet so that each source and destination connection is represented as a single row. This also has the connection mechanism codes split into individual columns to allow easier processing in the map generation. This sheet pulls in the spatial information for the arrows on the maps (‘LinkGeom’ attribute) or crosses that represent no connections (‘NoLinkGeom’) using lookup tables from the ‘Arrow-Geom-LUT’ and ‘NoConnection-Geom-LUT’ sheets.
2.Point-extract: This contains all the ‘no connection’ points from the ‘Values connectivity’ dataset. This was saved as working/ GBR_NESP-TWQ-3-3-3_Seascape-connectivity_no-con-pt.csv and used by the QGIS maps to draw all the crosses on the maps. This table is created by copy and pasting (values only) the ‘1-Vertical-data’ sheet when the ‘NoLinkGeom’ attribute is used to filter out all line features, by unchecking blank rows in the ‘NoLinkGeom’ filter.
2.Line-extract: This contains all the ‘connections’ between regions from the ‘Values connectivity’ dataset. This was saved as working/GBR_NESP-TWQ-3-3-3_Seascape-connectivity_arrows.csv and used by the QGIS maps to draw all the arrows on the maps. This table is created by copy and pasting (values only) the ‘1-Vertical-data’ sheet when the ‘LinkGeom’ attribute is used to filter out all point features, by unchecking blank rows in the ‘LinkGeom’ filter.
Map-Atlas-Settings: This contains the metadata for each of the maps generated by QGIS. This sheet was exported as working/GBR_NESP-TWQ-3-3-3_Seascape-connectivity_map-atlas-settings.csv and used by QGIS to drive its Atlas feature to generate one map per row of this table. The AttribID is used to enable and disable the appropriate connections on the map being generated. The WKT attribute (Well Known Text) determines the bounding box of the map to be generated and the other attributes are used to display text on the map.
map-image-metadata: This table contains metadata descriptions for each of the value attribute maps. This metadata was exported as a CSV and saved into the final generated JPEG maps using the eAtlas Image Metadata Editor Application ( https://eatlas.org.au/tools/image-metadata-editor).
Seascape-connectivity-maps.qgs:
This is a Quantum GIS ( https://www.qgis.org) file used to generate all the connectivity maps. To view all the maps use: Project / Layout manager, select Template and ‘Show’ then ‘Preview Atlas’. See the video tutorial for more details ( https://vimeo.com/335053846).
Data Dictionary:
Each connection between regions was marked with codes that represented the connection strength, mechanism and confidence.
Confidence
1: Low (assumptions only)
2: Medium (expert judgement)
3: High (observational data, experimental evidence, published data)
Connection strength:
W: Weak connection
S: Strong connection
N: No connection
Larval or Juvenile connection mechanism from breeding site:
AD: Activity dispersal (for example: something that swims)
PD: Passive dispersal (planktonic larvae that drift with ocean currents)
Adult connection mechanism:
DT: Daily travel (movement for feeding)
M: Migration (movement driven by seasons)
B: Breeding (going to breed)
Human Values key (type of connectivity)
VR: Visit for resource use (fishers or tourism operators crossing jurisdictions for the purposes of using natural resources)
VO: Other Visit (residents, researchers, government, tourists or others visiting across jurisdictions)
M: Migration (individuals choosing to migrate to the other jurisdiction)
Data Location:
This dataset is filed in the eAtlas enduring data repository at: data\custodian\2017-2019-NESP-TWQ-3\3.3.3_northeast-seascape-connectivity
Simple
Identification info
- Date (Publication)
- 2019-05-10
- Cited responsible party
-
Role Organisation Name Telephone Delivery point City Administrative area Postal code Country Electronic mail address Principal investigator Australian Institute of Marine Science Lawrey, Eric, Dr Voice Townsville Queensland Australia e.lawrey@aims.gov.au Collaborator James Cook University Johnson, Johanna Australia j.johnson@c2o.net.au Collaborator C20 Pacific David Welch d.welch@c2o.net.au
- Credit
- The following experts contributed to the data collection associated with this dataset: Catherine Collier, Len McKenzie, Paul Marshall, Paul Groves, Jon Brodie, Guillermo Diaz-Pulido, Line Bay, Tristan Simpson, Maria Zann, Karlo Hock, Eric Lawrey, John Olds, Brad Congdon, Johns Olds, Libby Evans-Illidge, John Kung, Dave Welch, Peter Speare, Andy Warmbrunn, Martin Russell, Nadeena Beck, Colin Simpfendorfer, Mick Bishop, Mark Hamann, Helene Marsh, Neil Gribble, Clive Turnbull, Sven Uthicke, Nadine Marshall, Eliza Glasson, Alicia Loveless, Jon Day, Piers Dunstan, Kahlytah Ahwang, Peter Illidge, Jim Higgs
- Point of contact
-
Role Organisation Name Telephone Delivery point City Administrative area Postal code Country Electronic mail address Point of contact Australian Institute of Marine Science Lawrey, Eric, Dr Voice Townsville Queensland Australia e.lawrey@aims.gov.au
- Spatial representation type
- Text, table
- Topic category
-
- Biota
Extent
Extent
- Description
- Great Barrier Reef, Torres Strait, Coral Sea and Great Sandy Strait, Australia

Temporal extent
- Time period
- 2017-08-17T00:00:00 2018-09-05T00:00:00
Resource constraints
- Linkage
-
http://i.creativecommons.org/l/by/3.0/au/88x31.png
License Graphic
- Title
- Creative Commons Attribution 3.0 Australia License
- Cited responsible party
-
Role Organisation Name Telephone Delivery point City Administrative area Postal code Country Electronic mail address
- Website
-
http://creativecommons.org/licenses/by/3.0/au/
License Text
- Language
- English
- Character encoding
- UTF8
Distribution Information
- OnLine resource
- Project web site
- OnLine resource
- View all 59 maps generated from this dataset
Metadata
- Metadata identifier
- urn:uuid/5b7f73ff-b23e-44d2-a2aa-2d7fa588d5ca
- Language
- English
- Character encoding
- UTF8
- Contact
-
Role Organisation Name Telephone Delivery point City Administrative area Postal code Country Electronic mail address Point of contact Australian Institute of Marine Science (AIMS) eAtlas Data Manager Voice Facsimile PRIVATE MAIL BAG 3, TOWNSVILLE MAIL CENTRE Townsville Queensland 4810 Australia e-atlas@aims.gov.au
Type of resource
- Resource scope
- Dataset
- Metadata linkage
-
https://eatlas.org.au/data/uuid/5b7f73ff-b23e-44d2-a2aa-2d7fa588d5ca
Point of truth URL of this metadata record
- Date info (Creation)
- 2021-03-29T06:18:14
- Date info (Revision)
- 2026-02-17T08:45:30.148Z
Metadata standard
- Title
- ISO 19115-3:2018