 eAtlas Data Catalogue
Water Quality data for sites in Gully Remediation (NESP TWQ 2.1.4, CSIRO)
This dataset contains Water Quality monitoring data collected at the project gully sites for the three reporting wet seasons 2016-2017, 2017-2018 and 2018-2019.
The data in presented in this metadata are part of a larger collection and are intended to be viewed in the context of the project. For further information on the project, view the parent metadata record: Demonstration and evaluation of gully remediation on downstream water quality and agricultural production in GBR rangelands (NESP TWQ 2.1.4, CSIRO).
Monitoring of these sites is continuing as part of NESP TWQ Project 5.9. Any temporal extensions to this dataset will be linked to from this record.
Methods:
A description of the water quality sampling procedures for this project is outlined in Baker et al.,(2016).
An automatic monitoring station was installed at each of the treatment gullies (See Key Localities). The monitoring station recorded rainfall, stage height, turbidity and water temperature at 1-min intervals during runoff events. The station also housed an ISCO auto-sampler that collected 1-L water samples at programmed intervals across the hydrograph (samples were processed as described below). A camera was installed at the treatment sites to capture photos during runoff events.
Each of the control sites were fitted with a simpler tripod monitoring station that measured rainfall, stage height and turbidity. Bulk water quality samples were collected manually after each (accessible) event using poly-pipe rocket structures. Data from both the treatment and control sites had telemetered communications to allow remote access of data.
Unidata Starflow QSD ultrasonic doppler was installed above the turbidity sensor at each site in 2017. The sensor measures the velocity of particles or bubbles in the water (presumed to be the same velocity as the water) using the doppler shift between transmitted and received ultrasonic signals. The sensors are mounted facing downstream to reduce the impact of particles damaging the sensor face and debris build up on measurement. The sensors require reconfiguration from factory default settings to capture data in gully systems.
A description of the water quality sampling procedures for this project is outlined in Baker et al., (2016). In brief, following significant runoff events that triggered the samplers, the ISCO bottles were collected and the samples were filtered and frozen if collected within 24 hours of the event. These samples were analysed for TSS and the full suite of nutrients (total nitrogen, total dissolved nitrogen, NH3, NOx, total phosphorus, total dissolved phosphorus, FRP) at the JCU TropWater Laboratory, Townsville. Samples that were not collected within 24 hours were analysed for TSS only. A sub-set of the samples collected were also sent for particle size analysis. The samples were processed on a Malvern Mastersizer which is a laser diffraction analyser with a lens range of 0.02 – 2000 µm.
Telemetered data from the loggers was captured to a fileserver and subsequently extracted, checked and combined with lab sample results in Excel. The files in this data collection represent the final combined dataset of all water quality and rainfall data from each site.
Linear relationships between TSS and TN sample concentrations and coincident turbidity data were derived for all sites (Table 6). Turbidity data was not used when (i) the instrument exceeded the instrument calibration threshold; (ii) turbidity sensor readings were erroneous due to damage or sensor malfunction, or when the sensors were buried.
Format:
This data collection consists of 5 zip files (one for each paired gully monitoring site). Zip files are named according to the property on which they are located. Each zip file contains six MS Excel spreadsheets representing 3 years of water quality monitoring and rainfall data for both the Control and Treatment gully sites. MS Excel files contain tabs representing the following:
Notes
Rainfall
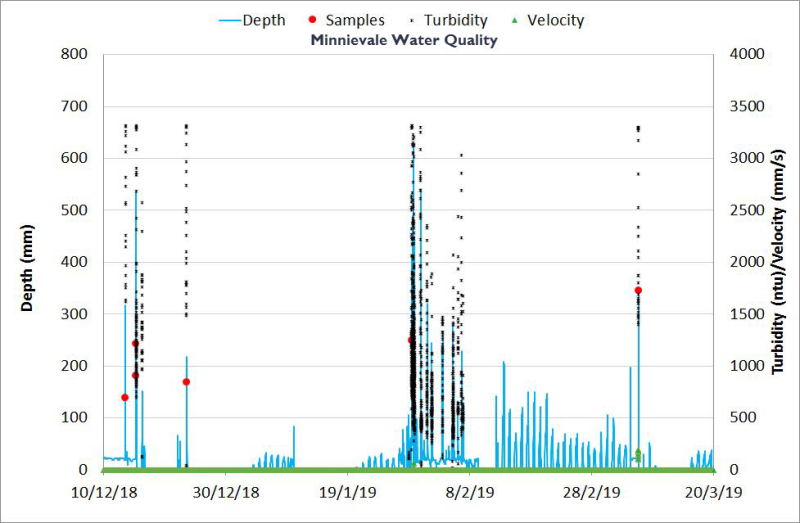
Stream data (Timestamp, Depth, Turbidity, Rain, Photo cnt, Velocity)
Sample Data (Timestamp, BottleNo, EventNo, SampleNo, Depth, Turbidity)
Lab Results (combined with sample data)
Chart of Stream and Sample data for the whole year and reporting
Charts of Stream and Sample data for each flow event
Each zip file contains an additional Excel spreadsheet “WQ_QA_vs_Turb_<site>.xlsx” with tabs “control” and “treatment” containing a summary of all water quality lab analyses for all years and an assessment of the quality (Quality_code) of each sample. Further tabs show the turbidity-TSS and turbidity-N relationships subsequently developed for use in discharge and load estimates.
As well as the 5 zip files, this collection contains a single spreadsheet summarising all particle size measurements for the sites: “NESP_particle size_summary_all_sites.xlsx”
Data Dictionary:
Column headings used in the Water Quality Excel spreadsheets:
Timestamp – time in AEST (+10GMT)
Depth – Depth of flow above depth sensor in millimetres, Depth sensor was level with gully bed at time of installation.
Turbidity – turbidity in units of NTU
Velocity - Velocity is in units of mm/sec
(note that the Turbidity and velocity sensors are mounted at between 100 and 400 mm above the depth sensor).
Rain – rainfall in millimetres during period between current timestamp and previous timestamp
PhotoCnt – site photo count value associated with timestamp
BottleNo – Bottle number associated with ISCO sampler
EventNo – Event number associated with sample
SampleNo – Sample Number as submitted to Lab.
Lab Results – headings are self-explanatory
TSS = Total Suspended Sediment
Column headings used in Particle_size sptreadsheet:
Year – Wet season over which particle size sample was collected
Event - indicator to allow for differentiation between events
Site – site at whch samples awas collected (codes below)
Date – sample collection date
Sample number
TSS – Total Suspended Sediment recorded in Stream data at sample timestamp
<10 um - fraction of sample < 10 microns size
Particle size - D10 - diameter (microns) at which 10% of the sample's mass is comprised of particles less than this diameter
Particle size - D50 - diameter (microns) at which 50% of the sample's mass is comprised of particles less than this diameter
Particle size - D90 - diameter (microns) at which 90% of the sample's mass is comprised of particles less than this diameter
Source – the source of the data (name) if not CSIRO
(Where D10,50,90 is the of < 10 micrometres).
WQ_QA_vs_Turb_<site>.spreadsheets:
“Treatment” and “Control” tabs contain Lab Results for all years at Treatment and Control gullies. An additional Quality_Code is used to assign a quality value to the Samples:
0 = good for tss/turb relationship & concentrations
1 = turbidity probe error - concentration data OK
2 = turbidity probe out of range - concentration data OK
3 = sample error (don’t use for concentrations) but turb data is OK
The “TSS-Turb” and “N-Turb” contain the lab results used to derived the TSS-Turb and N-Turb relationships at each site.
Site Codes used in filenames or Site columns are as follows:
MIN = Minnievale
MV = Meadowvale
MW = Mount Wickham
SB = Strathbogie
VP = Virginia Park
<T/C> - Treatment/Control
Note:
SBT is now the Strathbogie Control site
SBC (to 2018) and SBT2 (after 2018) is now the Strathbogie Treatment site
References:
Baker, B., Hawdon, A. and Bartley, R., 2016. Gully remediation sites: water quality monitoring procedures, CSIRO Land and Water, Australia.
Bartley, R., Hawdon, A., Henderson, A., Wilkinson, S., Goodwin, N., Abbott, B., Bake, B., Boadle, D., and Ahwang, K. (2019) Quantifying the effectiveness of gully remediation on off-site water quality: preliminary results from
demonstration sites in the Burdekin catchment (third wet season). Report to the National Environmental Science Programme. Reef and Rainforest Research Centre Limited, Cairns (115 pp.).
Data Location:
This dataset is filed in the eAtlas enduring data repository at: data\NESP2\2.1.4-Gully-Remediation-effectiveness
Simple
Identification info
- Date (Creation)
- 2019-07-02
- Date (Publication)
- 2019-08-23
- Cited responsible party
-
Role Organisation Name Telephone Delivery point City Administrative area Postal code Country Electronic mail address Principal investigator CSIRO Land and Water Bartley, Rebecca Dr Voice facsimile EcoSciences Precinct, 41 Boggo Road Dutton Park Queensland 4102 Australia rebecca.bartley@csiro.au Collaborator CSIRO Land and Water Henderson, Anne Voice facsimile Bld 145 ATSIPJames Cook University Douglas Queensland 4812 Australia anne.henderson@csiro.au Collaborator CSIRO Land and Water Hawdon, Aaron Voice facsimile Bld 145 ATSIPJames Cook University Douglas Queensland 4812 Australia aaron.hawdon@csiro.au
- Point of contact
-
Role Organisation Name Telephone Delivery point City Administrative area Postal code Country Electronic mail address Point of contact CSIRO Land and Water Bartley, Rebecca Dr Voice facsimile EcoSciences Precinct, 41 Boggo Road Dutton Park Queensland 4102 Australia rebecca.bartley@csiro.au
- Topic category
-
- Biota
Extent
Extent
- Description
- Queensland, Australia

Temporal extent
- Time period
- 2015-11-04 2019-03-31
Resource constraints
- Linkage
-
http://i.creativecommons.org/l/by/3.0/au/88x31.png
License Graphic
- Title
- Creative Commons Attribution 3.0 Australia License
- Cited responsible party
-
Role Organisation Name Telephone Delivery point City Administrative area Postal code Country Electronic mail address
- Website
-
http://creativecommons.org/licenses/by/3.0/au/
License Text
- Language
- English
- Character encoding
- UTF8
Distribution Information
- OnLine resource
- NESP TWQ Project page
- OnLine resource
- eAtlas Web Mapping Service (WMS) (AIMS)
- OnLine resource
- Project web site
- OnLine resource
- Survey Spreadsheets 2016 - 2019 + Charts + Metadata [Zip 510 kB]
Metadata constraints
- Linkage
-
http://i.creativecommons.org/l/by/3.0/au/88x31.png
License Graphic
- Title
- Creative Commons Attribution 3.0 Australia License
- Cited responsible party
-
Role Organisation Name Telephone Delivery point City Administrative area Postal code Country Electronic mail address
- Website
-
http://creativecommons.org/licenses/by/3.0/au/
License Text
Metadata
- Metadata identifier
- urn:uuid/dc4e7e2d-1b84-4942-827b-8ff628ea84de
- Language
- English
- Character encoding
- UTF8
- Contact
-
Role Organisation Name Telephone Delivery point City Administrative area Postal code Country Electronic mail address Point of contact Australian Institute of Marine Science (AIMS) eAtlas Data Manager Voice facsimile PRIVATE MAIL BAG 3, TOWNSVILLE MAIL CENTRE Townsville Queensland 4810 Australia e-atlas@aims.gov.au
Type of resource
- Resource scope
- Dataset
- Metadata linkage
-
https://eatlas.org.au/data/uuid/dc4e7e2d-1b84-4942-827b-8ff628ea84de
Point of truth URL of this metadata record
- Date info (Creation)
- 2019-10-22T01:33:30
- Date info (Revision)
- 2023-09-18T07:29:31
Metadata standard
- Title
- ISO 19115-3:2018